Member-only story
Visualize the German Railway System with Kepler.gl
Create maps for stations and routes in Jupyter
Back in the day, the young German railway was organized more like a military than a transport company. Trains were punctual and workers were disciplined. Nowadays, it is a national sport to mock the Deutsche Bahn (DB). Delays are frequent and cancelations are often. This stark contrast is no surprise because the German railway system has become more complex. And it is hard to operate such a vast and intricate network without some hiccups.
It is difficult to appreciate this complex system without some good visualizations. You can see the vein-like railway network in the GeoViewer by Deutsche Bahn itself. But I would like to do some flight paths such as this one for the German railway. In this case, I turn to Kepler.gl.
In my previous article Level up Google Earth Engine with Kepler.gl, I have demonstrated how to generate beautiful maps with this free, WebGL-empowered library. These maps are not only esthetically pleasing, but they also help us to better understand the world.
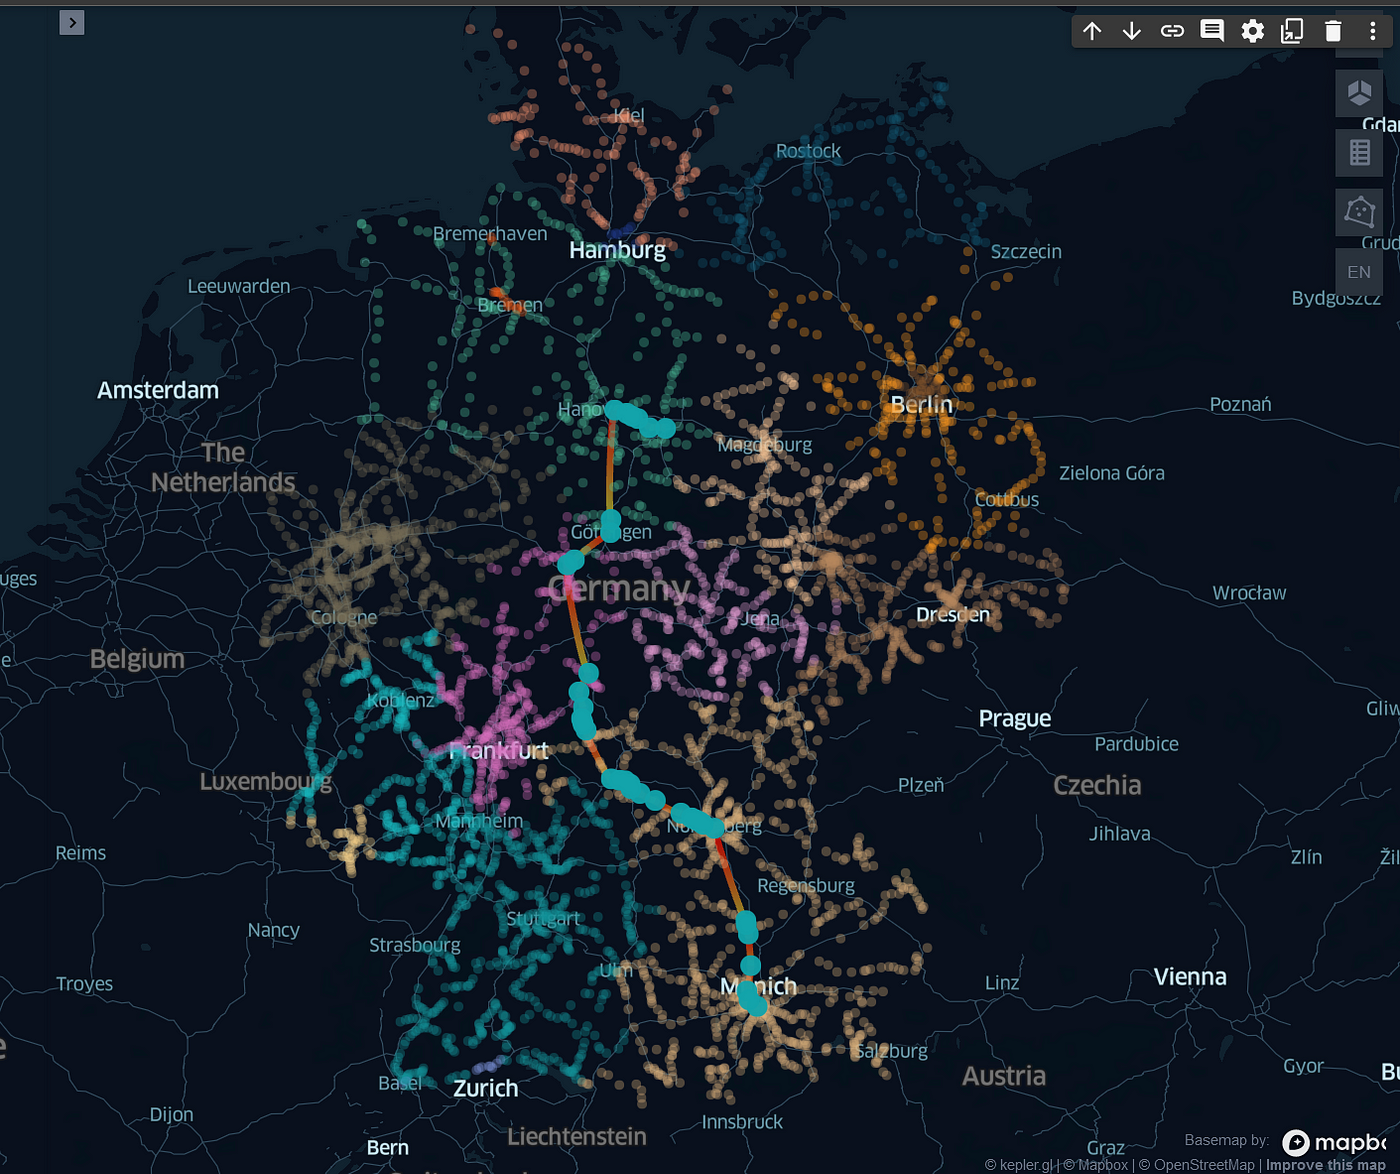
In this article, I would like to create three maps for the Deutsche Bahn: the train stations, the optimal route between two stations, and all the stations that lead directly from and to Berlin (no transit). Instead of the online tool, I…

